
Figure 1.
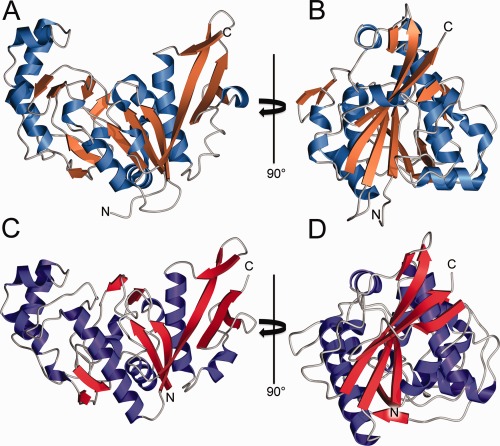
Experimental and predicted structures of E. coli YaaA. (A and B) The experimentally determined crystal structure shown as a ribbon diagram, with β‐strands colored orange and α‐helices blue. YaaA possesses a new fold and has an apical depression that is rich in basic residues. (C, D) CASP model T0806TS064_1‐D1 is shown in the same orientation as the experimental structure in panels A and B. The excellent overall agreement between experiment and prediction is apparent. In some areas, relatively minor differences in backbone torsion angles result in differing secondary structure assignments.