
Figure 4.
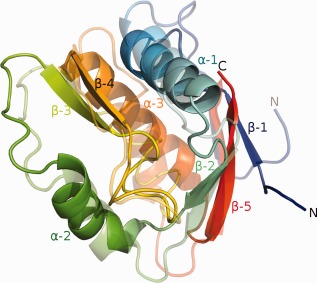
The NucB protein. A ribbon diagram of the crystal structure of NucB (solid colors) superimposed on the best prediction, TS064_2 (semitransparent colors). In both instances, the ribbon is color‐ramped from blue to red, corresponding to the N‐ and C‐termini, respectively.