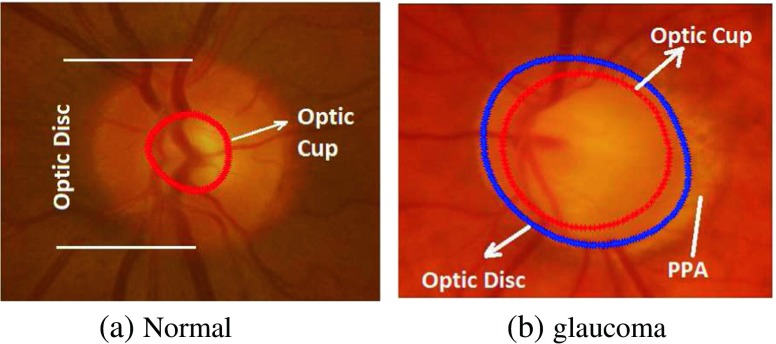
Fig. 1.
Comparison of the optic disc area of the a normal and b glaucomatous image. The cup boundary is shown with the red outline in both images and disc boundary is shown with blue outline in (b) only. There is significantly larger cup in relation to the size of the optic disc in the glaucoma image compared to the normal image. Inferior sector Peripapillary Atrophy (PPA) in the glaucoma image (b) is also evident possibly due to concomitant erosion of the inferior neuro-retinal rim tissue

