
Figure 3.
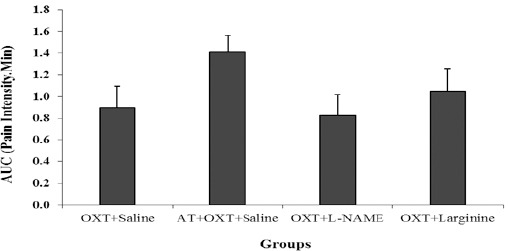
Comparison AUC (area under the curve) in Atosiban (AT)+ OXT + saline, OXT + L-NAME and OXT + L-arginine groups with OXT+ saline group in the acute phase of the formalin test. Values are means±SEM (n = 12). Statistical analyses were made using the one-way ANOVA followed by the Tukey's test Post hoc