Figure 3.

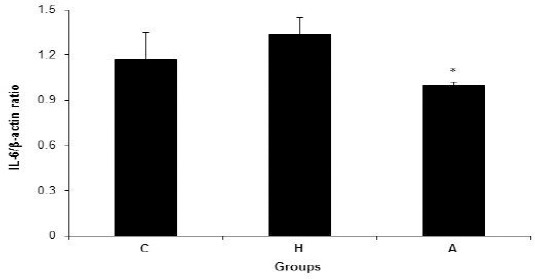
IL-6/β-actin ratio in control, hyperlipidemic, and adropin-treated groups of rats; * Shows significance between groups H and A (P≤0.05) (Mann Whitney U test); C: control, H: hyperlipidemic, A: adropin treatment groups, IL-6: Interleukin 6

IL-6/β-actin ratio in control, hyperlipidemic, and adropin-treated groups of rats; * Shows significance between groups H and A (P≤0.05) (Mann Whitney U test); C: control, H: hyperlipidemic, A: adropin treatment groups, IL-6: Interleukin 6