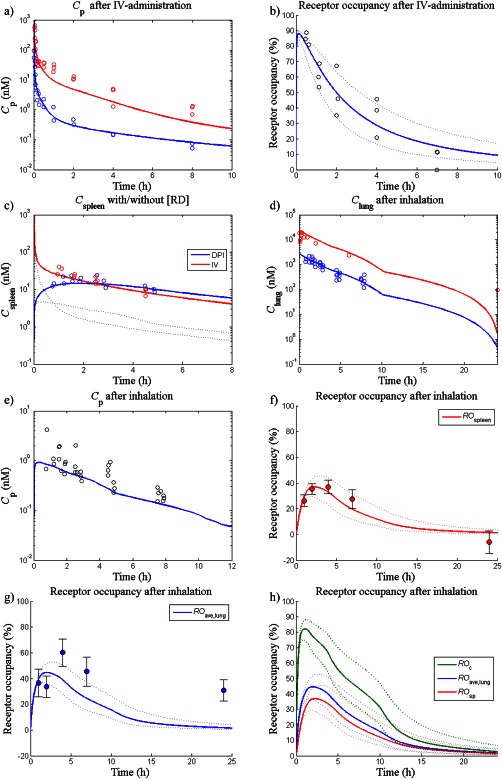
Figure 2.

Simulations and observations of: (a) plasma concentrations (Cp) after i.v. administration of 90 (blue line) and 1,000 nmol/kg (red line), (b) receptor occupancy in the spleen/peripheral lung/central lung after i.v. administration of 90 nmol/kg (blue line), (c) spleen concentration (Cspleen) after i.v. administration of 90 nmol/kg (red line) and after inhalation of a lung deposited dose (LDD) of 11.3 nmol/kg (blue line). The dashed lines show Cspleen excluding the receptor‐bound concentration (d) total lung concentrations after an LDD of 11.3 nmol/kg (blue line) and 100 nmol/kg (red line), (e) Cp after a LDD of 11.3 nmol/kg (blue line), (f) receptor occupancy in the spleen (ROsp) after an LDD of 11.3 nmol/kg (red line), (g) whole lung receptor occupancy (ROave) after an LDD of 11.3 nmol/kg (blue line), and (h) receptor occupancy in the central lung (ROc), ROave, and ROsp after an LDD of 11.3 nmol/kg (green, blue, and red line, respectively). For each receptor occupancy simulation, a 90% confidence interval was created by a Monte Carlo simulation, which repeatedly sampled random values from a lognormal distribution of the binding kinetics parameters (n = 1,000, dashed lines). DPI, dry powder inhalation.
