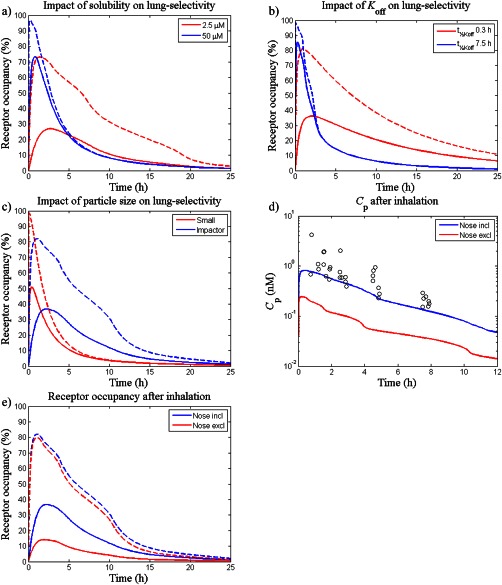
Figure 3.

The impact of different drug‐, formulation‐, and system‐specific properties on lung‐selectivity was evaluated by varying the following parameters: (a) solubility; Cs=2.5 µM (red line) and 50 µM (blue line), (b) dissociation rate; t½, Koff=7.5 h (blue line) and 0.3 h (red line), (c) particle size distribution; f 1,…,f 8 from Table 2 (blue line) and fi = 0.25 for i = 5, …, 8 and fi = 0 otherwise (red line), (d) nasal absorption; nose included (blue line) and nose excluded (red line), and e) nasal absorption; nose included (blue line) and nose excluded (red line). Except for subfigure e) which shows predictions (lines) and observations (open circles) of plasma concentrations of fluticasone propionate (Cp), dashed lines represent receptor occupancy in the central lung and solid lines represent occupancy in a systemic reference organ.
