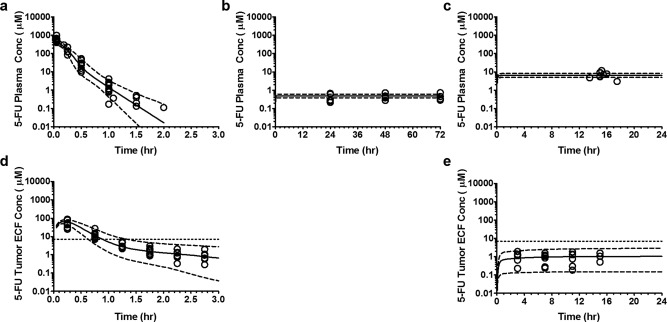
Figure 2.

Visual predictive check of preclinical pharmacokinetic model representing plasma and tumor extracellular fluid concentration (tECF) disposition of 5‐fluorouracil (5‐FU) in ependymoma bearing mice. (a, b, and c) Plasma concentration‐time profile of 5‐FU at dosage of 75 mg/kg given as i.v. bolus injection, 75 mg/kg given as 3‐day infusion, and 13 mg/kg/hr infusion over 24 hours, respectively, plotted on semi‐log scale. (d and e) The tECF concentration‐time profile of 5‐FU at dosage of 75 mg/kg given as i.v. bolus injection and 13 mg/kg/hr infusion over 24 hours, respectively, plotted on semi‐log scale. (Open circle represents observed plasma or tECF concentration; solid line represents the median (50th percentile) of model predicted individual concentrations; dashed line represents the 5th and 95th percentile of model predicted individual plasma concentrations.) Supplementary Figure 4 shows this figure in the linear scale.
