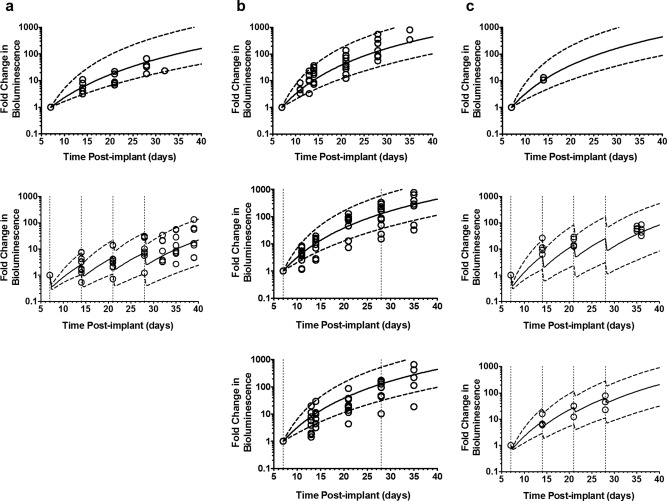
Figure 3.

Visual predictive check of preclinical pharmacodynamics model representing tumor growth in control and treated groups in ependymoma bearing mice. (a) Experiment one in which mice were either not treated (top) or treated with 75 mg/kg i.v. bolus 5‐fluorouracil (5‐FU) once every week (bottom); (b) represents experiment two in which mice were either not treated (top) or treated with 75 mg/kg 5‐FU infusion over 3 (middle) or 5 days (bottom) once every 21 days; (c) represents experiment three in which mice were either not treated (top) or treated with 75 (middle) or 37.5 (bottom) mg/kg i.v. bolus 5‐FU once every week. (Open circle represents observed fold increase in bioluminescence; solid line represents the median (50th percentile) of model predicted individual fold increase in bioluminescence; dashed line represents the 5th and 95th percentile of model predicted individual fold increase in bioluminescence; vertical dotted lines indicate 5‐FU dosing.)
