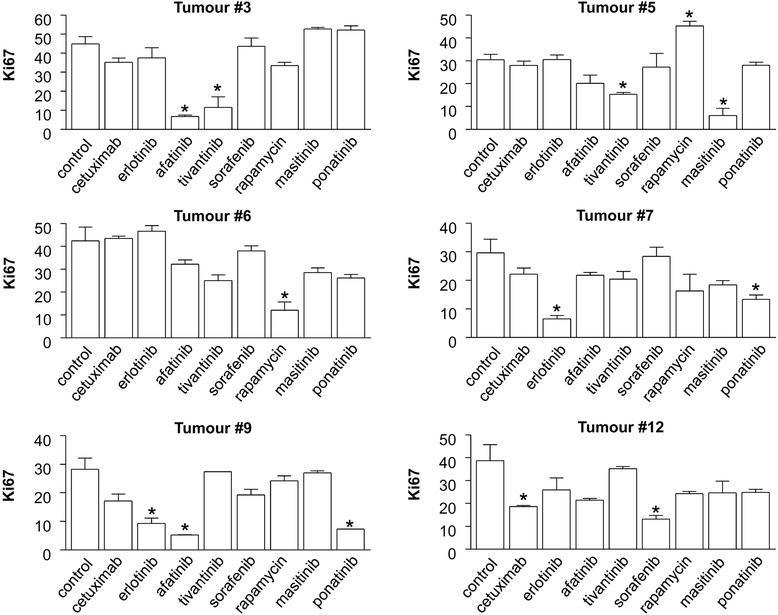
Fig. 2.

Effect of targeted therapies on the cell proliferation index in six representative HNSCC tumours in short-term culture. The histograms represent the average % of tumour nuclei stained with Ki67. The average presented is based on the automatic quantification of 20 tumour fields from two slides, representing a minimum of 1000 tumour cells for each condition, as indicated in the Materials and methods section. Each treatment was maintained in culture for 48 h. Note that each individual tumour presents a different % of Ki67-positive cells in control conditions, reflecting individual differences in the basal proliferative index. * indicates a statistically-significant difference compared to control conditions, corresponding to culture without treatment, with p <0.05 (Student’s t-test)
