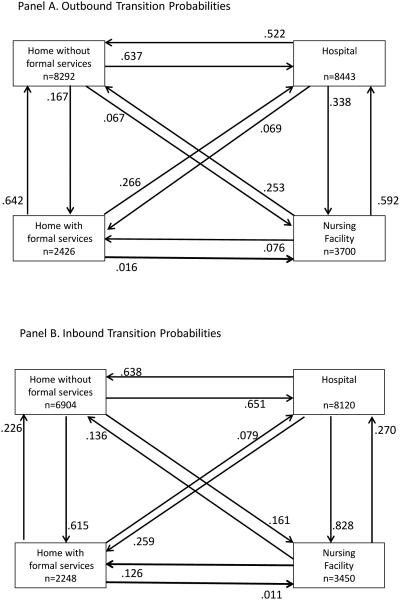
Figure 1. Outbound and Inbound Transition Probabilities.
Panel A. Each box represents one of four mutually exclusive sites of care. The number within each box represents the total number of transitions out of this site of care. For each site of care there are three lines that lead out of it and into the other three sites of care. The number next to each arrow represents the conditional probability of the transition out of the site of care and into the other site of care. When combined with the conditional probability of a transition out of the site due to death (data not shown), the sum of the three conditional probabilities out of each site of care equals 1.
Panel B. Each box represents one of four mutually exclusive sites of care. The number within each box represents the total number of transitions into this site of care. For each site of care there are three lines that lead to it from the other three sites of care. The number next to each arrow represents the conditional probability of the transition into the site of care from the other site of care. The sum of the three conditional probabilities into each site of care equals 1.

