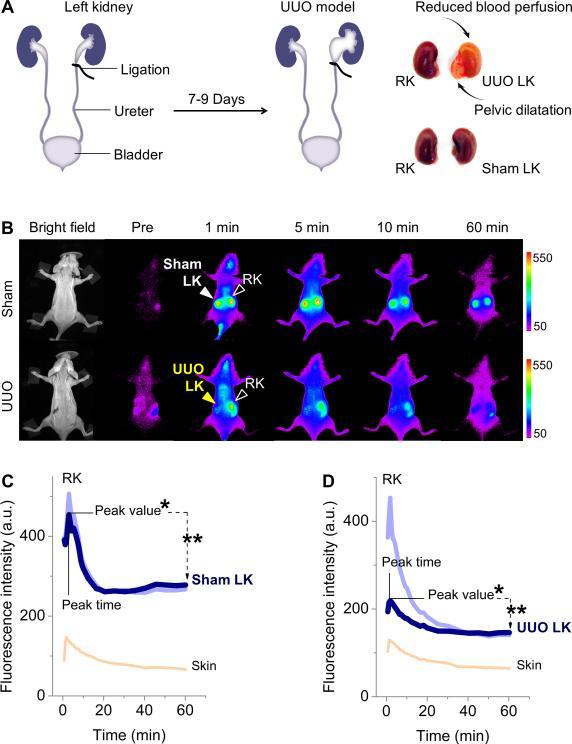
Figure 1.
(A) Unilateral ureteral obstruction (UUO) in mice was generated by complete ligation of the left ureter while the right ureter was kept intact. For sham-operated group the left ureters were exposed but not ligated. (B) Representative whole-body noninvasive fluorescence images of mice before and after intravenous injection of GS-AuNPs (Ex/Em filters: 710/830 nm). (C,D) Time-fluorescence intensity curves (TFICs) of kidneys in sham control (C) and UUO model (D). Four parameters were extracted from kidney TFICs: peak value, peak time = peak time of the first peak, *percentage of relative renal function (% RRF = [peak value of left kidney (LK) or right kidney (RK) / (peak value of LK + peak value of RK)]×100%), **clearance percentage at 60 min = [(peak value – intensity at 60 min) / peak value]×100%.

