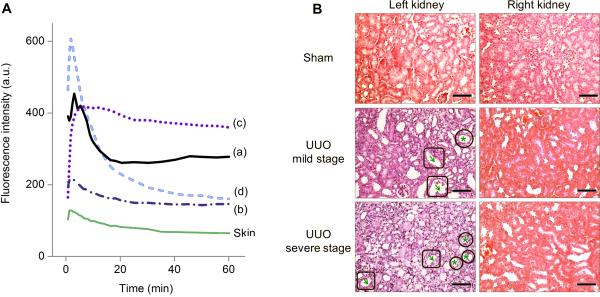
Figure 3.
Correlation of time-fluorescence intensity curve (TFIC) patterns with the degrees of renal damage. (A) Representative TFICs of sham left kidney (sham LK) (a), UUO LKs (b, c), and UUO model's right kidney (RK in UUO, d), corresponding to four statuses of kidney function: (a) normal function, (c) mild dysfunction, (b) severe dysfunction, and (d) adaptive function. Skin TFIC was obtained from the same mouse showing pattern (b) of UUO LK. (B) Pathologic analysis of kidneys of UUO mice and sham control (H&E stain, scale bar = 100 μm). Arrows in square: tubular dilatation; stars in circle: tubular atrophy. Nucleus was stained in violet and cytoplasm was stained in pink. From sham LK to UUO LKs, the color change from pink to violet reflected a loss of cytoplasm, the characteristic of cellular atrophy. RKs were normal.

