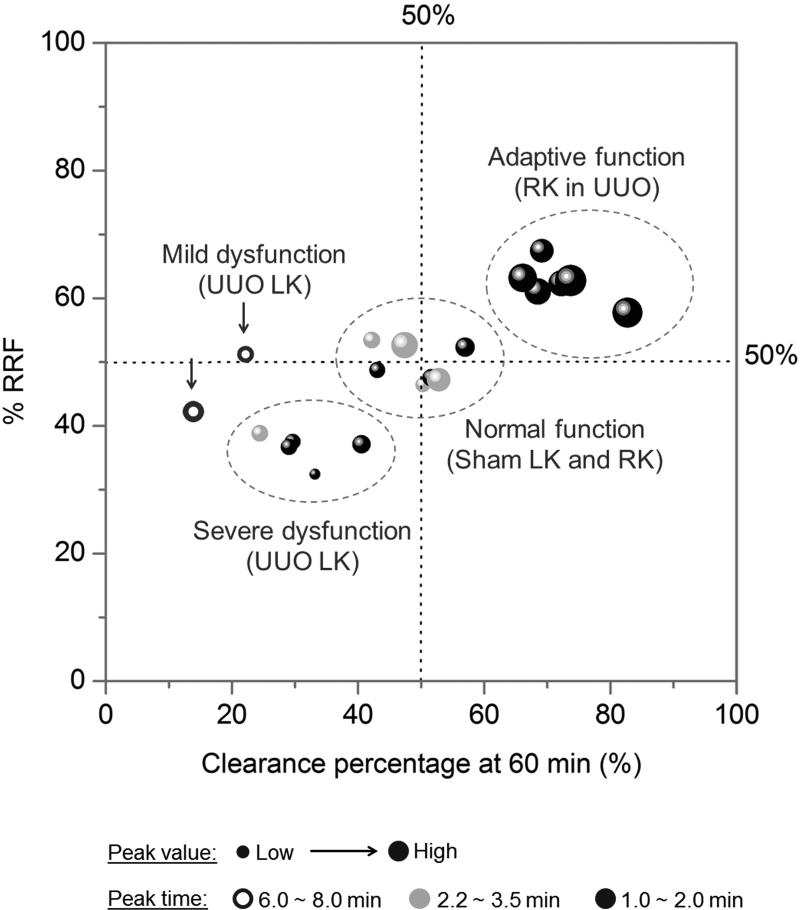
Figure 4.
Four functional statuses of kidney in UUO model can be clearly differentiated by plotting the four parameters of TFICs in one figure. X = clearance percentage at 60 min, Y = % RRF, bubble size = peak value, bubble color = peak time (black, 1.0 ~ 2.0 min; gray , 2.2 ~ 3.5 min; hollow circle, 6.0 ~ 8.0 min). Data were obtained from 20 kidneys in 10 mice and presented in Table S2 and S3 (N = 7 for UUO model; N = 3 for sham control).

