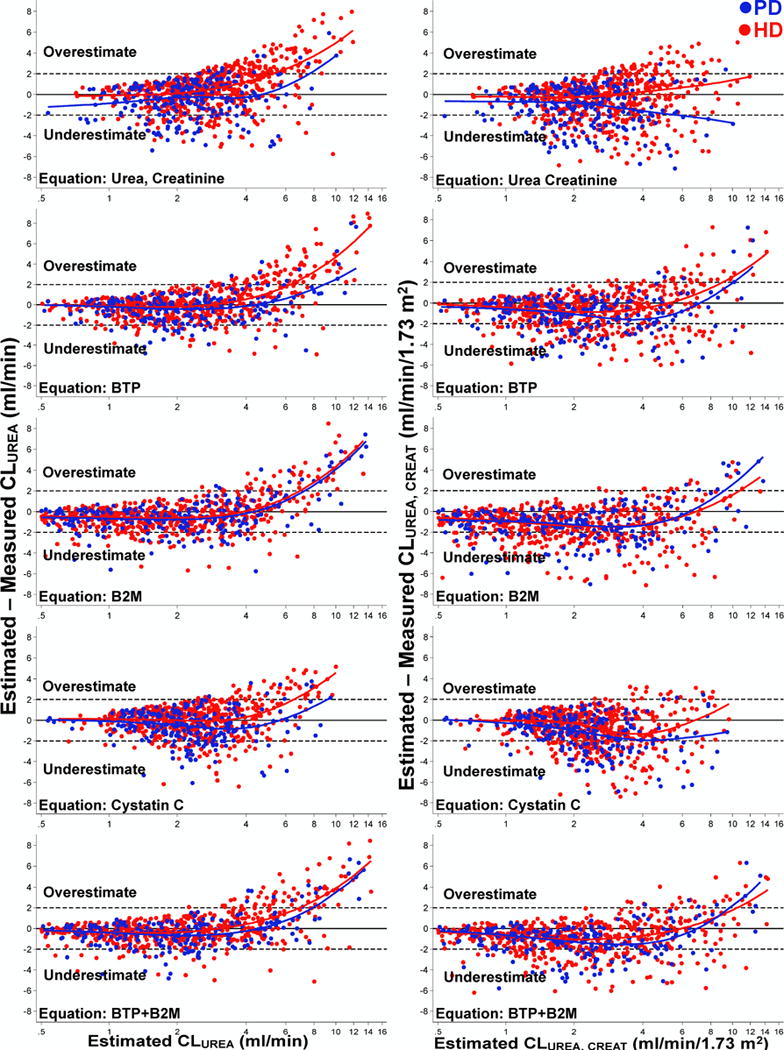
Figure 2. Association between Estimated and Measured Clearances in 826 Dialysis Patients of the Validation Cohort, The Netherlands Cooperative Study on the Adequacy of Dialysis (NECOSAD).

The difference between estimated and measured clearance is presented on the vertical (Y) axis and estimated clearance on the horizontal (X) axis. Positive numbers on the Y axis represent overestimation of measured clearance and negative numbers represent underestimation. Excluding extreme observations, defined as estimated clearance (X axis) >99th percentile or <0.5 mL/min for CLUREA (0.5 mL/min/1.73 m2 for CLUREA, CREAT) and difference between estimated and measured clearance (Y axis) >99th percentile or <1st percentile. Data from patients on peritoneal dialysis are displayed as blue dots and data from patients on hemodialysis are displayed as red dots. Blue and red lines are model fits from median quantile regression of bias on measured clearance modeled as restricted cubic spline with 4 quantile knots. Solid black line represents bias=0. Panel A (left): Results for urinary urea clearance (CLUREA) in mL/min; and Panel B (Right): Results for average of urinary urea and creatinine clearance (CLUREA, CREAT) in mL/min/1.73 m2.
Abbreviations: CLUREA, urinary urea clearance (mL/min); CLUREA, CREAT, average of urinary urea and creatinine clearance (in ml/min/1.73 m2); PD, peritoneal dialysis; HD, hemodialysis; BTP, β-trace protein; B2M, β2 microglobulin.
