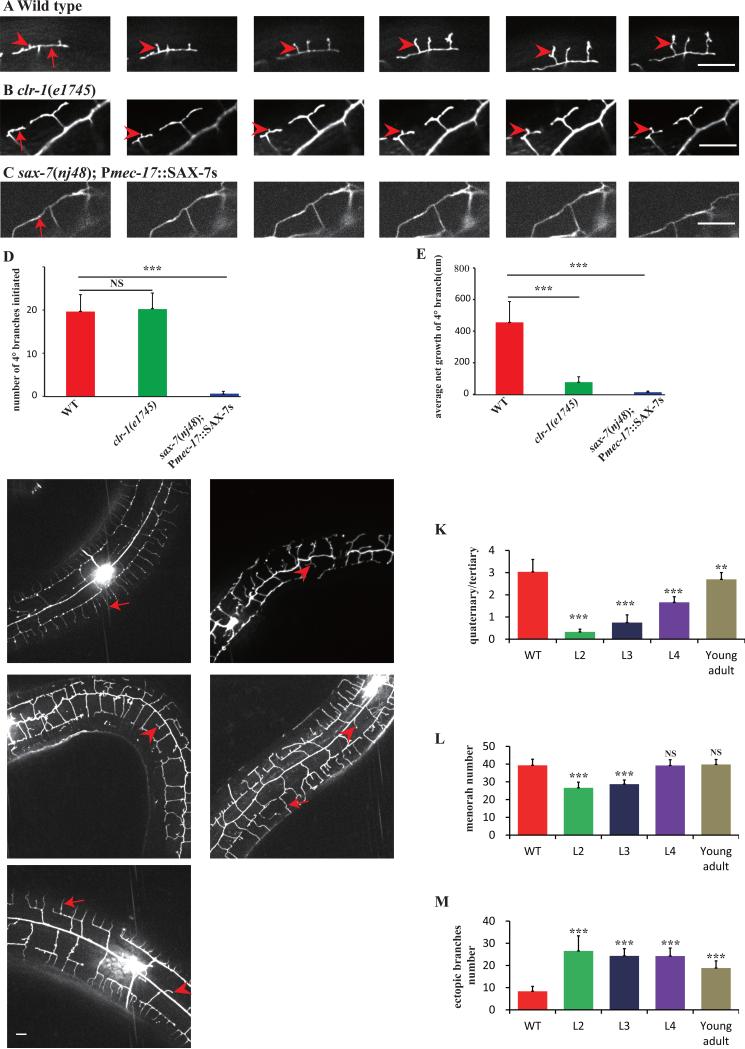
Fig. 3. Time-lapse imaging analyses of 4° branches development.
A-C) Still images of time-lapse movies obtained from a wild type (upper panel), a clr-1(e1745ts) mutant (middle panel), and a sax-7(nj48); Pmec-17::SAX-7s animal (lower panel). Numbers on each picture represent time (minutes) when the image was taken. Red arrows mark the 3° branches and red arrowheads indicate the growing 4° branches. Scale bar is 10μm. D) Quantification of the number of 4° branches initiation. E) Quantification of 4° branches net growth in 2h in a visual filed near the cell body. Error bars, SEM. NS means not significant, ***p < 0.001 using ANOVA followed by a posthoc test. n>9 for each genotype. F-J) Confocal images of wild type or clr-1(e1745ts) young adult animals shifted from 15°C to 25°C at L2, L3, L4, young adult stage. K) Quantification of PVD 4° branches phenotype in wild type, and clr-1(e1745) shifted at L2, L3, L4, young adult stage. Y-axis is the average ratio of the number of 4° branches/the number of 3° branches. I) Quantification of the number of menorah in wild type and clr-1(e1745) shifted at L2, L3, L4, young adult stage. J) Quantification of PVD ectopic branches in wild type and clr-1(e1745) shifted at L2, L3, L4, young adult stage. Error bars, SEM. NS means not significant, ***p < 0.001 and **p < 0.01 using ANOVA followed by a posthoc test. n>30 for each genotype.

