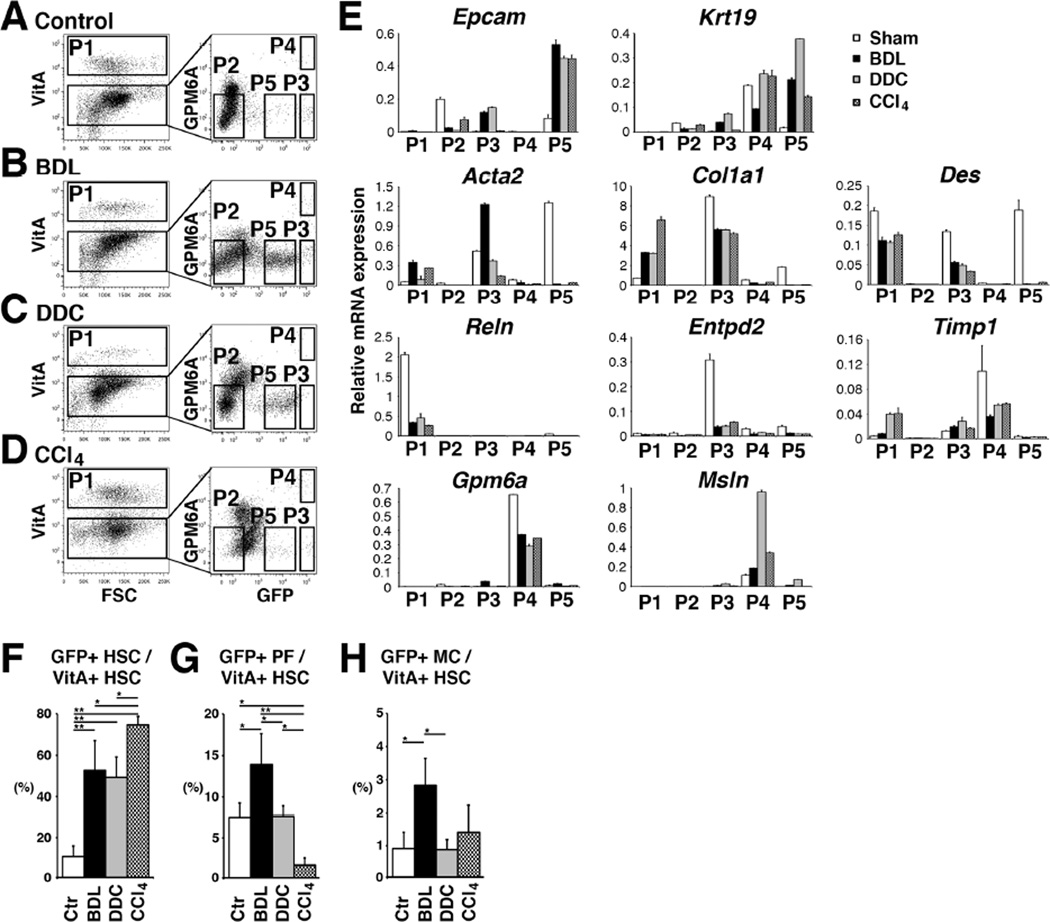
Figure 7. Isolation of HSCs, PFs, and MCs from Col1a1GFP fibrotic livers.
(A–D) NPCs were prepared from control (A, n=6) or injured Col1a1GFP livers induced by BDL (B, n=6), DDC (C, n=3), and CCl4 (D, n=4). PI− cells were analyzed for autofluorescence of VitA and P1 VitA+ HSCs were sorted. The VitA− fraction was further analyzed for the expression of GPM6A and GFP. P1–P5 factions were sorted for further analysis. (E) QPCR of P1–P5 fractions. (F–H) Percentages of GFP+ HSCs (F), PFs (G), and MCs (H) in VitA+ HSCs in different models. *P<0.05, **P<0.01.

