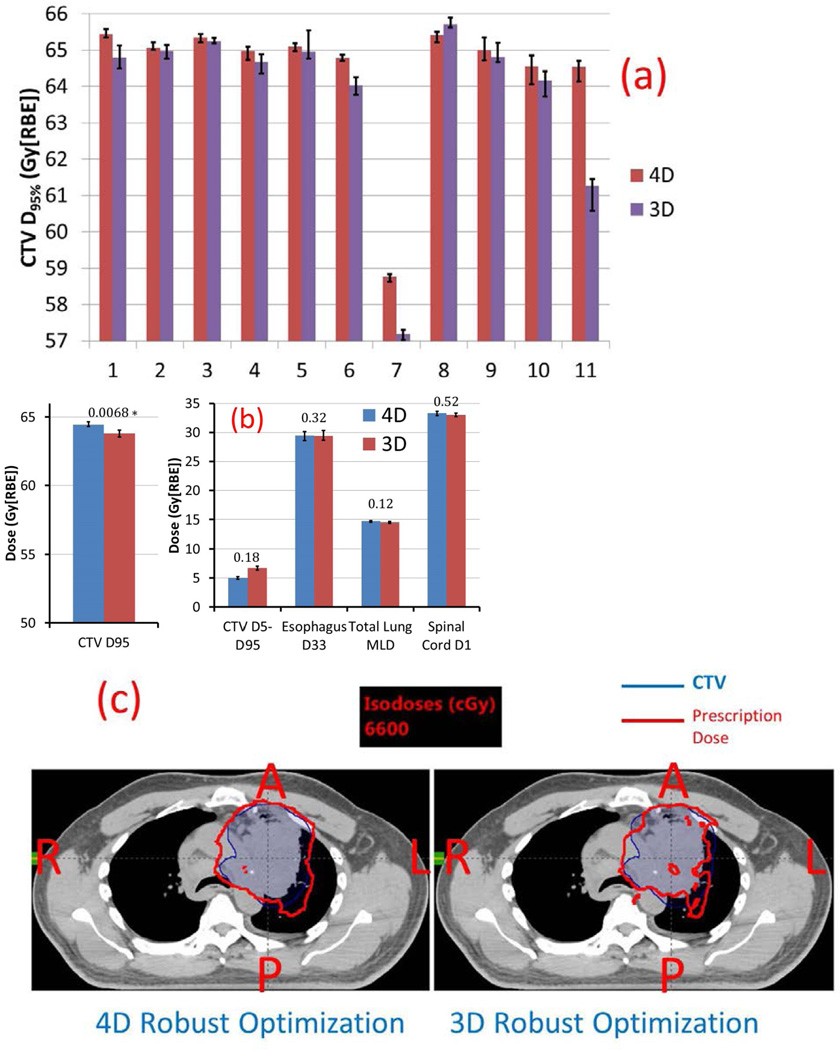
Figure 3.
A, Comparison of 11 patients’ CTV D95% of the dynamic doses of 4D (red) and 3D (purple) robust optimization. Error bars indicate maximum and minimum values of D95% among 5 runs. B, Comparison of averaged target D95%, D5%–D95%, spinal cord D1%, total normal lung mean dose Dmean, and esophagus D33%. Numbers at the top of the columns are P values. C, Dose distributions in the transverse plane illustrate that the 4D robust optimization plan (left) was less affected for patient 11 by interplay effect than the 3D robust optimization plan (right).
*p values are statistically significant after Bonferroni correction of 0.05/5 tests = 0.01.

