
Figure 1. Forest plot for incident micro- and macrovascular complications.
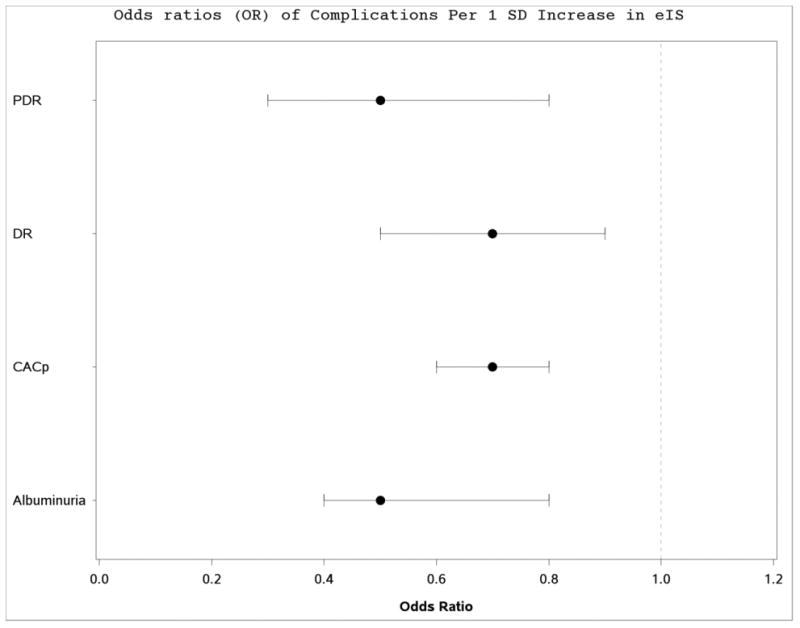
Data is presented as OR and 95% CI. OR represent the increase in odds of developing albuminuria, DR, PDR and CACp for every 1 SD increase in the eIS (1.58 mg/kg-1 min-1)
Official websites use .gov
A
.gov website belongs to an official
government organization in the United States.
Secure .gov websites use HTTPS
A lock (
) or https:// means you've safely
connected to the .gov website. Share sensitive
information only on official, secure websites.
Data is presented as OR and 95% CI. OR represent the increase in odds of developing albuminuria, DR, PDR and CACp for every 1 SD increase in the eIS (1.58 mg/kg-1 min-1)