Figure 1.

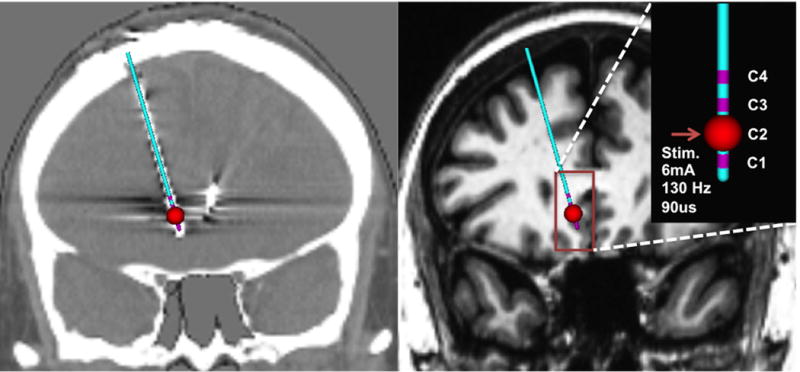
Identification of DBS lead in post-op CT (left) and Patient-specific volume of tissue activated modeling in T1 image (right) with given stimulation parameters frequency = 130Hz, pulse width = 90us, and stimulation amplitude = 6mA

Identification of DBS lead in post-op CT (left) and Patient-specific volume of tissue activated modeling in T1 image (right) with given stimulation parameters frequency = 130Hz, pulse width = 90us, and stimulation amplitude = 6mA