
FIGURE 1.
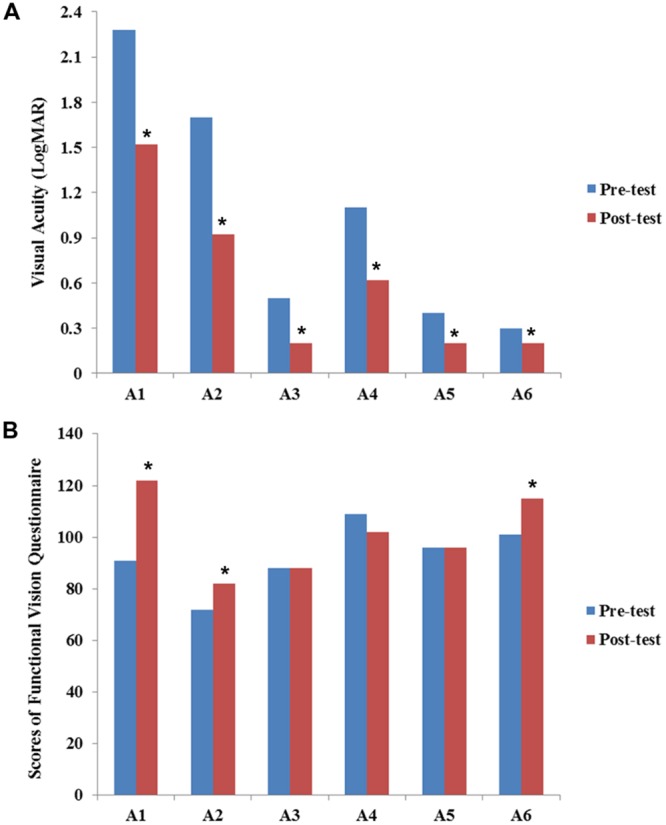
Results of visual acuity (A) and functional vision (B) before and after the VS program. Values of visual acuity and functional vision assessment are individually presented for six participants (A1–A6). Data are presented for pre-training (blue bars) and post-training (red bars). The scores of visual acuity are transferred and expressed in LogMAR scale. All participants showed improvement in VA after visual training. Statistical analysis also revealed significant differences between pre-VS and post-VS [Z = –2.20, asymptotic significance (2-tailed) = 0.028]. The Chinese version of the functional vision questionnaire was used to assess functional vision (full score = 140 points). Although some participants showed improvement in functional vision, no statistically significant difference was found [Z = –1.46, asymptotic significance (2-tailed) = 0.144]. Asterisk (∗) indicates improvement in the scores of VA and functional vision after VS program.