
FIGURE 2.
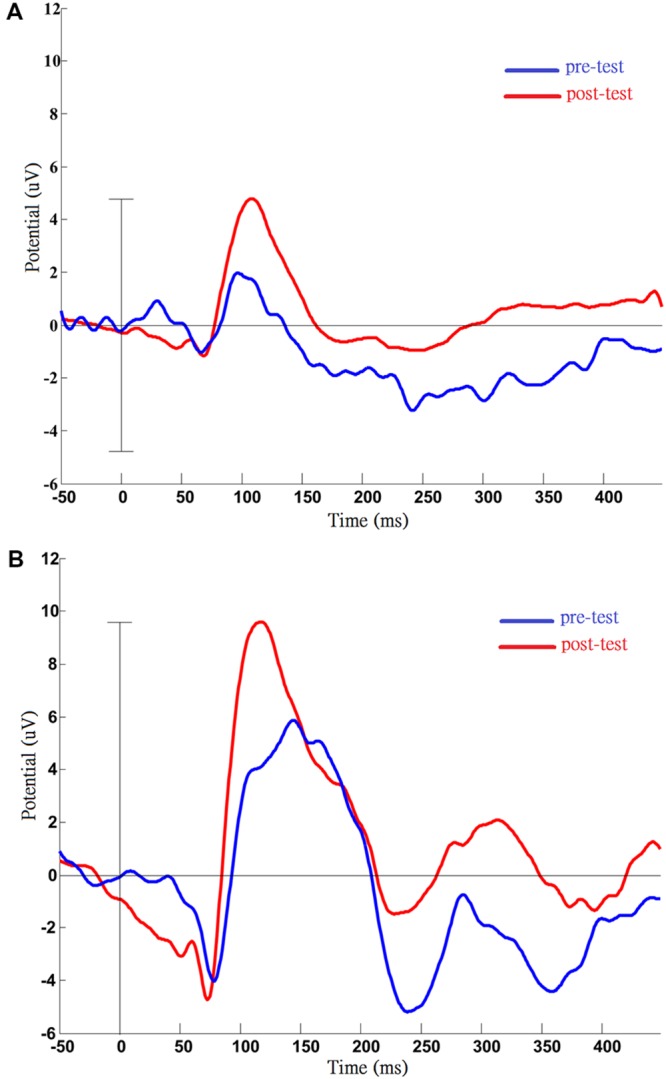
Results of pattern visual evoked potential (VEP) testing before and after the VS program in case A5 (A) and case A6 (B). Pre- and post-measurements of VEP were completed by case A5 and case A6. After training, the VEP amplitude was increased compared with pre-test, and this phenomenon was persistent in two cases. (A) Data from case A5: increased P100 amplitude (pre: 1.97 uV; post: 4.78 uV); (B) Data from case A6: post-training, shortened latency (pre: 144 ms; post: 118 ms), and increased amplitude of P100 (pre: 5.85 uV; post: 9.59 uV).