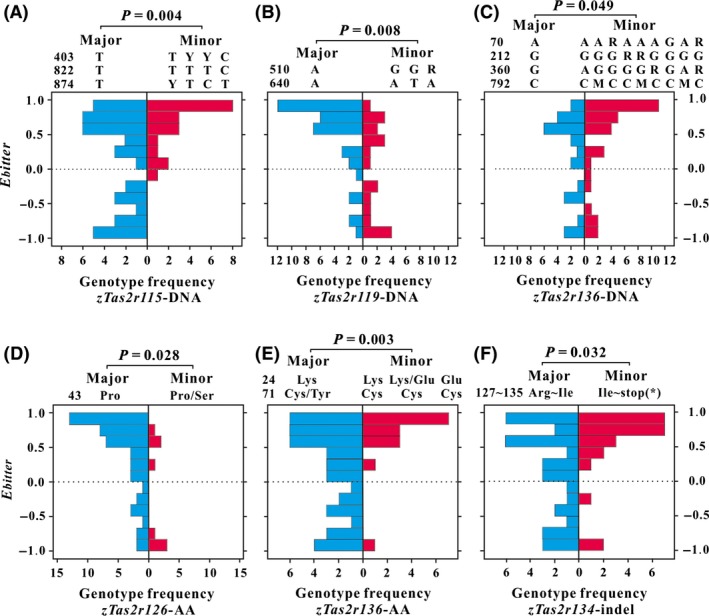
Figure 2.

Population pyramid of E bitter (selection index of bitter plants) of major and minor genotypes of the genes that have significant relationships with bitter plant selection. (A, B, and C) at DNA sequence level; (D and E) at amino acid (AA) sequence level; (F) only considering the indel site. The numbers before the major DNA/AA genotypes show the mutation sites of DNA/AA sequences; the blue and red bars show the frequency distributions of the 56 zokors with major and minor genotypes, respectively.
