
Figure 10.
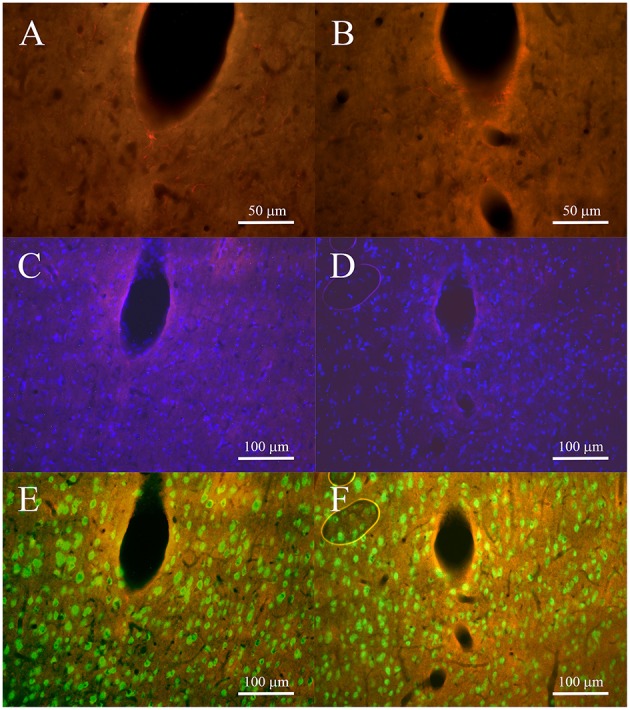
Fluorescence microscopy images of tracks for non-encapsulated (left panels) and pHEMA-encapsulated (right panels) microspheres 4 weeks after implant. (A,B) show the GFAP-positive cells (red) at 40 × to underline the morphology of astrocytes; (C,D) cell nuclei (blue) superimposed on GFAP staining to verify the density of DAPI surrounding the tracks; (E,F) neuron nuclei (green) superimposed on GFAP to show the presence of neuronal bodies surrounding the tracks.