
Figure 11.
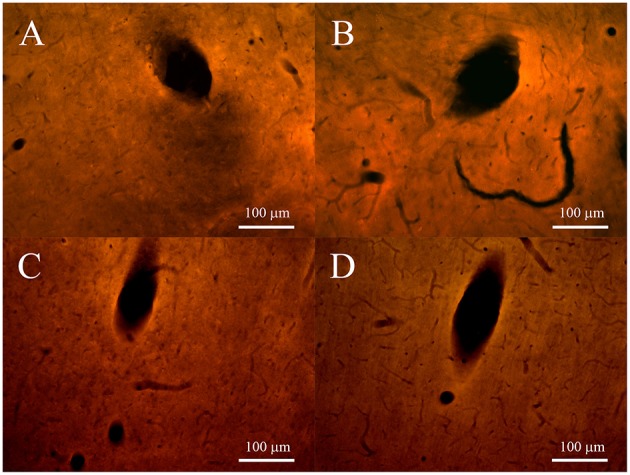
Fluorescence microscopy images of tracks for non-encapsulated (left panels) and pHEMA-encapsulated (right panels) microspheres, 2 and 4 weeks after the implant. (A,B) show the ED1-positive cells (red) at 20 × at 2 weeks; (C,D) show the ED1-positive cells (red) at 20 × at 4 weeks.