Figure 1.

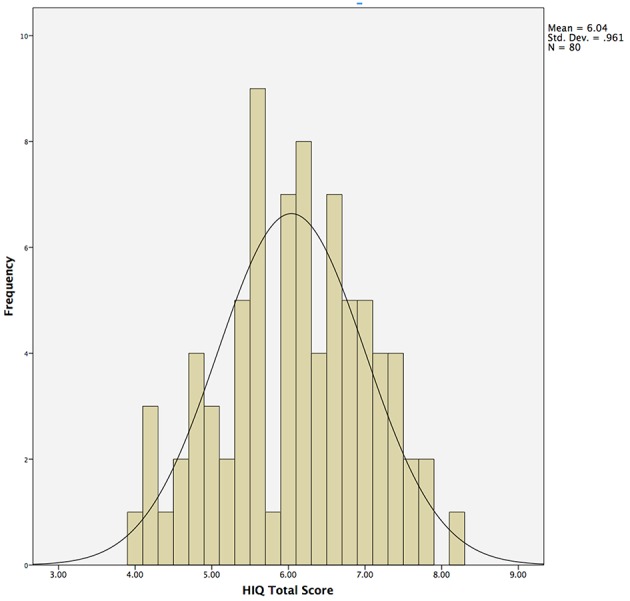
Histogram demonstrating normal distribution of Hunter Imagination Questionnaire (HIQ) total scores across the entire sample (N = 80).

Histogram demonstrating normal distribution of Hunter Imagination Questionnaire (HIQ) total scores across the entire sample (N = 80).