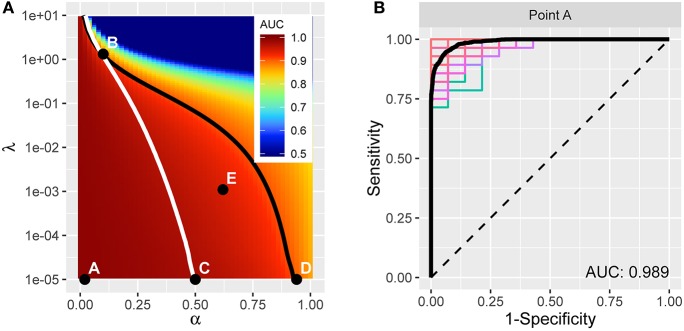
Figure 4.
(A) AUC for different tuning parameters, with each point averaged over 100 applications of two-fold cross-validation. The point A reflects the tuning parameter value yielding the maximum AUC, and is depicted in the curves in (B). The traces define a restricted space of tuning parameters. Above and to the right of the white trace yields no more than an average of 75 predictors, and below and to the left of the black trace reflects at least 0.90 AUC on average. (B) ROC curve (in black) reflecting high prediction accuracy based on 271 imaging predictors; AUC is 0.989. The colored curves highlight the variability associated with each separate CV sample.

