
Figure 4.
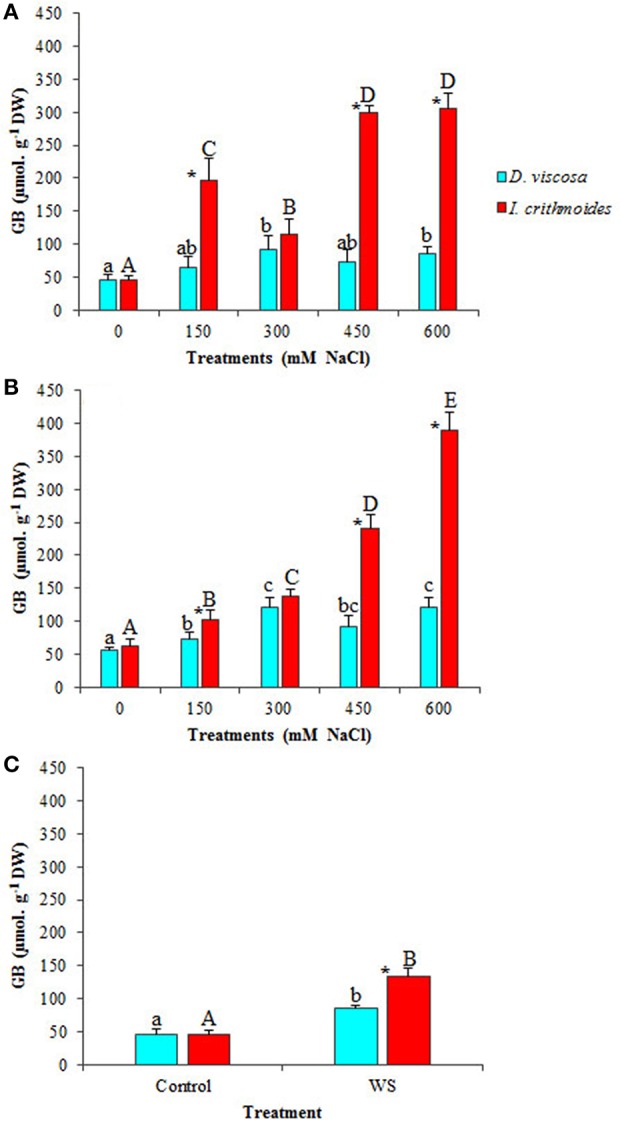
Glycine betaine (GB) accumulation in leaves of D. viscosa and I. crithmoides stressed plants. GB contents after 3 weeks (A) and 6 weeks (B) of treatment with the indicated NaCl concentrations, or after 3 weeks of water stress (C). Values shown are means ± SD (n = 5). Different letters (lowercase for D. viscosa and capital letters for I. crithmoides) over the bars indicate significant differences between treatments for each species according to Tukey test (α = 0.05). Asterisks (*) indicate significant differences between the two species for the same treatment.