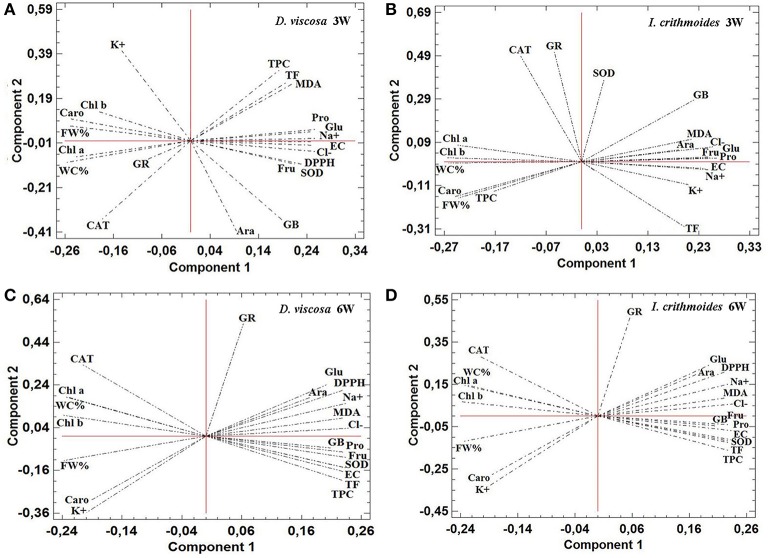
Figure 8.
Principal Component Analysis (PCA). Site score plots of the studied variables on the two principal components (1 and 2) for D. viscosa (A,C) and I. crithmoides (B,D) plants, after 3 weeks (A,B) and 6 weeks (C,D) of salt treatments. PCAs included, as the analyzed variables: electrical conductivity of the substrate at the end of the salt treatments (EC), fresh weight percentage (FW%), water content percentage (WC%), chlorophyll a (Chl a), chlorophyll b (Chl b), total carotenoids (Caro), sodium ions (Na+), potassium ions (K+), chloride ions (Cl−), glycine-betaine (GB), proline (Pro), arabinose (Ara), fructose (Fru), glucose (Glu), malondialdehyde (MDA), total antioxidant activity—DPPH scavenging activity—(DPPH), total flavonoids (TF), total phenolic compounds (TPC), and specific activity of catalase (CAT), glutathione reductase (GR), and superoxide dismutase (SOD). Values of the different parameters were obtained from the experiments shown in Figures 3–6 and Tables 1–4, and in “Supplementary Material” Table S1.

