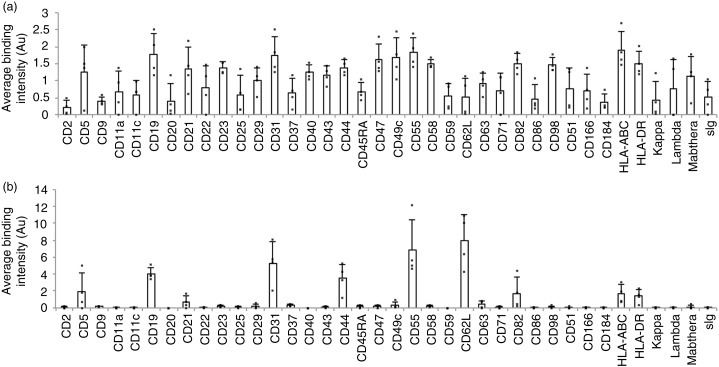
Fig. 4.
Comparison of DotScan surface profiles of PBMC (3×10⁶ cells; a) and CD19+, CD61-depleted EV (b) from the blood of CLL patients (n=4). DotScan analysis was carried out as for Figure 3. After background and isotype control subtraction and median centred normalization, averaged duplicate binding intensities (expressed in arbitrary units, Au) are shown for 38 antigens, each of which was detected on the cells of at least 2 of 4 CLL samples.

