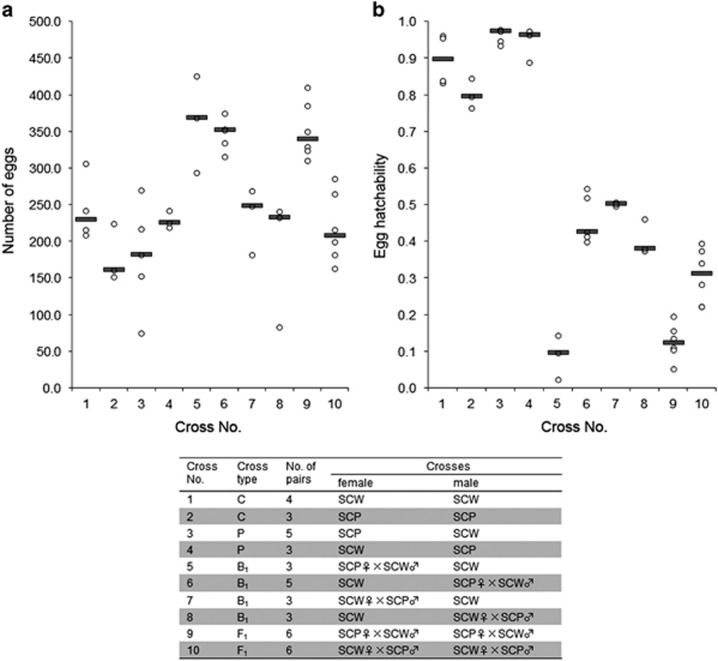
Figure 2.
Scatterplots of fecundity (a) and egg hatchability (b) in the control (C), parental (P) and F1 crosses, and backcrosses (B1) between Samia cynthia pryeri (SCP) and Samia cynthia walkeri (SCW). Grey bars represent median. Open circles show the number of eggs laid (a) and hatchability of eggs (b) for each mating.

