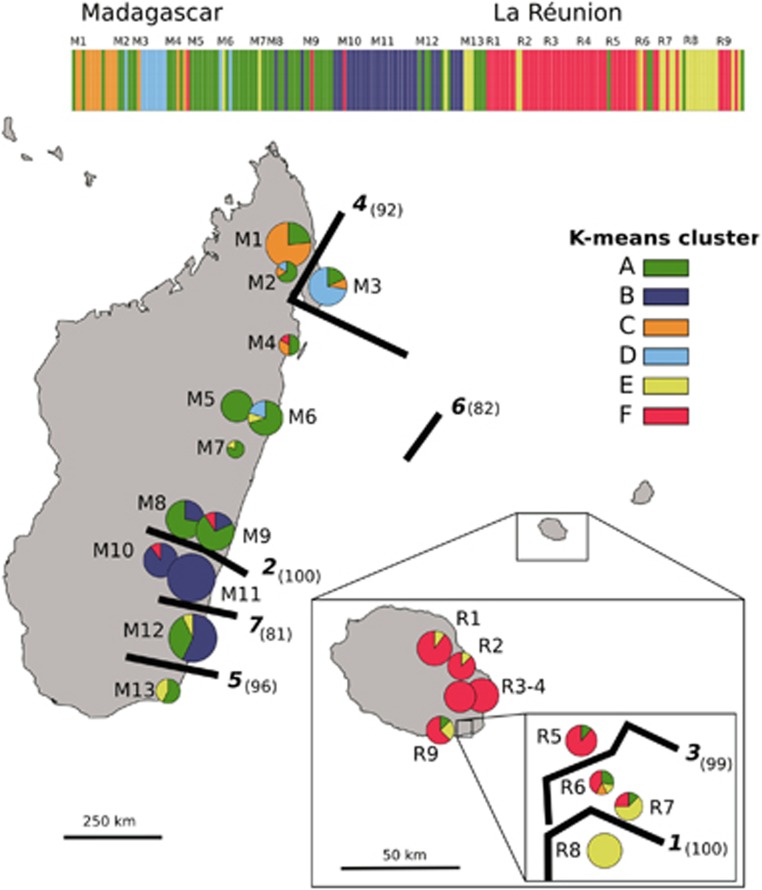
Figure 2.
Distribution of six AFLP gene pool clusters (A–F) within and among 22 populations (206 individuals) of B. occultum from Madagascar (M1–13) and La Réunion (R1–9) as identified by K-means clustering, and with pie charts representing the percentage of individuals. The sizes of the pie charts are proportional to sample size (n), with the smallest circle representing n=5 and the largest representing n=14 (see Table 2). The barplot at the top displays the assignment of individuals to the six K-means clusters, with the smallest vertical bar representing one individual. Significant regions of genetic discontinuity (black lines) identified by BARRIER are numbered (1–7) in descending order of relative importance (‘priority'), with bootstrap values (⩾80%) shown in parentheses (1000 replicates).

