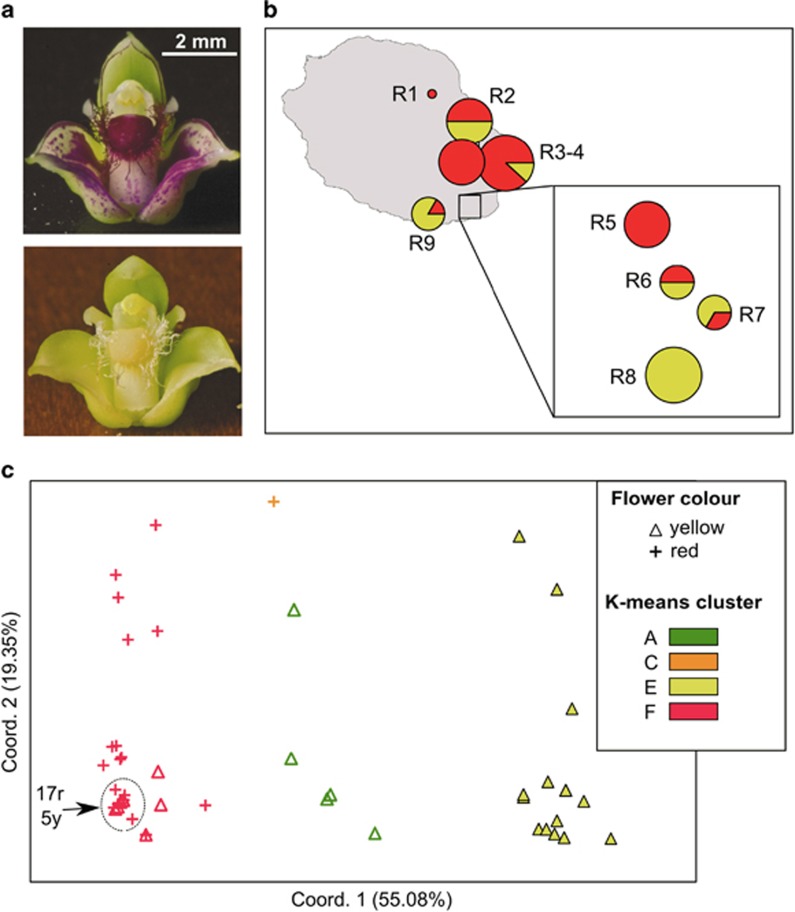
Figure 5.
(a) Red and yellow flower colour morphs of B. occultum from La Réunion. Photo credit: Joseph Vaillant (Parc National de La Réunion). (b) Their distribution (denoted by red vs yellow colour) censused across the nine populations (R1–9) surveyed for AFLP variation in La Réunion. The sizes of the pie charts are proportional to sample size (n), with the smallest circle representing n=1 and the largest n=10 (total n=61; see Table 1). (c) Plot of the first and second principal coordinates of 33 red morphs (crosses) and 28 yellow morphs (triangles) from populations R1–9 based on Euclidian distances derived from AFLP data. Individuals are colour-labelled according to the four AFLP groups detected by K-means clustering (see Figure 2). Numbers refer to densely clustered individuals with red (r) vs yellow (y) flower colour morphs within the dotted circle.

