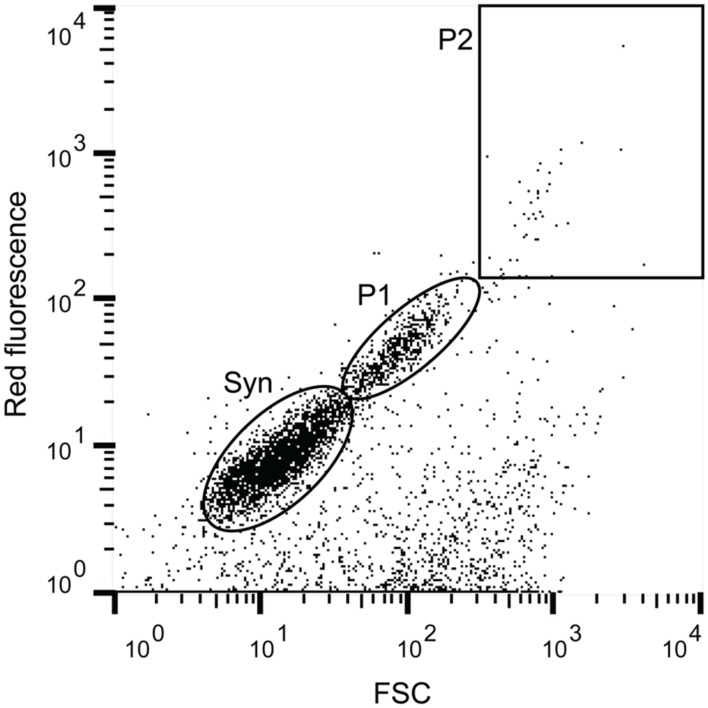
FIGURE 1.
Example of a flow cytogram with the cell populations that were targeted in this study. Red fluorescence was used as a proxy for chlorophyll a content and forward scatter (FSC) as a proxy for size. The indicated cell populations are Syn (Synechococcus) as defined by phycoerythrin content (Orange fluorescence), and two size fractions of photosynthetic picoeukaryotes, small (P1, ∼ <3 μm beads) and large (P2, ∼ >3 μm beads).

