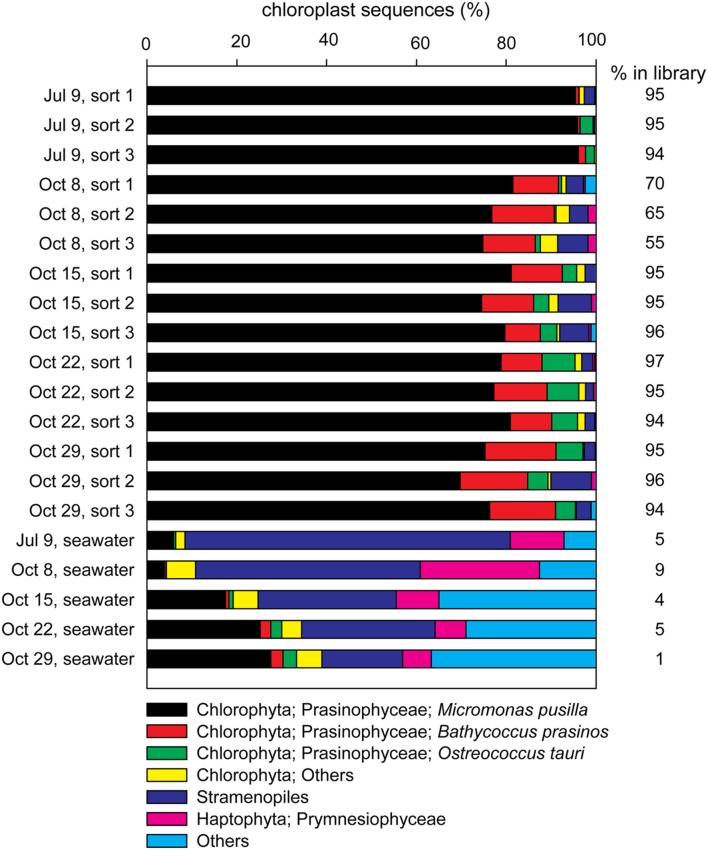
FIGURE 4.
Contributions of the most frequently occurring eukaryotic phyla among chloroplast sequences detected in each of the sorted photosynthetic picoeukaryote samples (1,000 P1 cells, triplicate samples) and the corresponding seawater samples (0.2–10 μm) for each sampling date. The percentage of chloroplast sequences within each library is indicated to the right of each bar.

