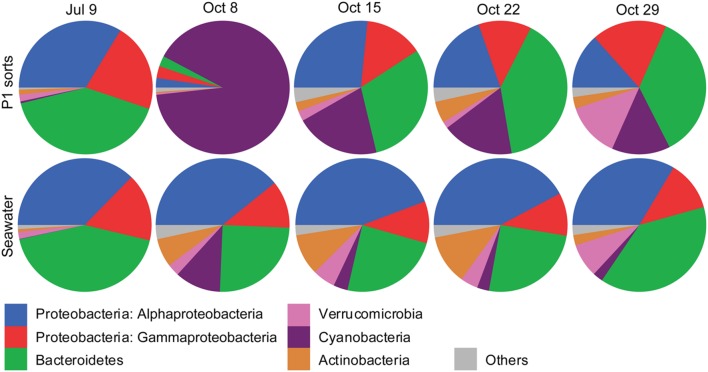
FIGURE 5.
Pie graphs showing the phylogenetic affiliations of non-Eukaryota 16S rRNA gene sequences in photosynthetic picoeukaryote sorts (P1, 1,000 cells), and bulk seawater (0.2–10 μm) from Illumina MiSeq libraries for each sampling date. The absolute numbers of sequences for the triplicate sort samples from each sampling date have been pooled. The colors for each phyla are indicated below the graphs.

