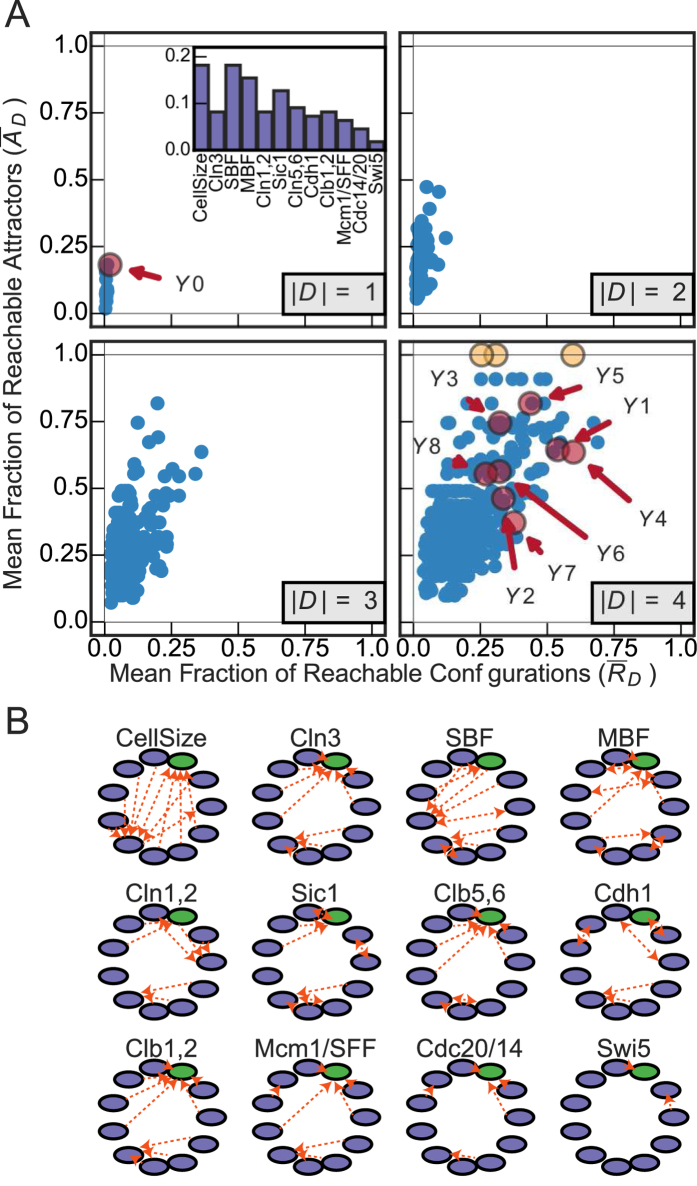
Figure 6.
(A) Control of the eukaryotic cell cycle of budding yeast Saccharomyces cerevisiae (CCN) for all driver variable subsets of size |D| = 1, |D| = 2, |D| = 3 and |D| = 4. (inset) The mean fraction of reachable attractors  for each singleton driver variable set. The subset predicted to fully control the network are highlighted in red and labeled
  for structural controllability (SC), while those predicted by minimum dominating sets (MDS) are labeled
  . The driver variable subsets with full attractor control are highlighted in yellow (see SM for further details). (B) Controlled Attractor Graphs (CAGs) for each singleton driver variable set. The wild-type attractor is highlighted in green, all other attractors are in purple.

