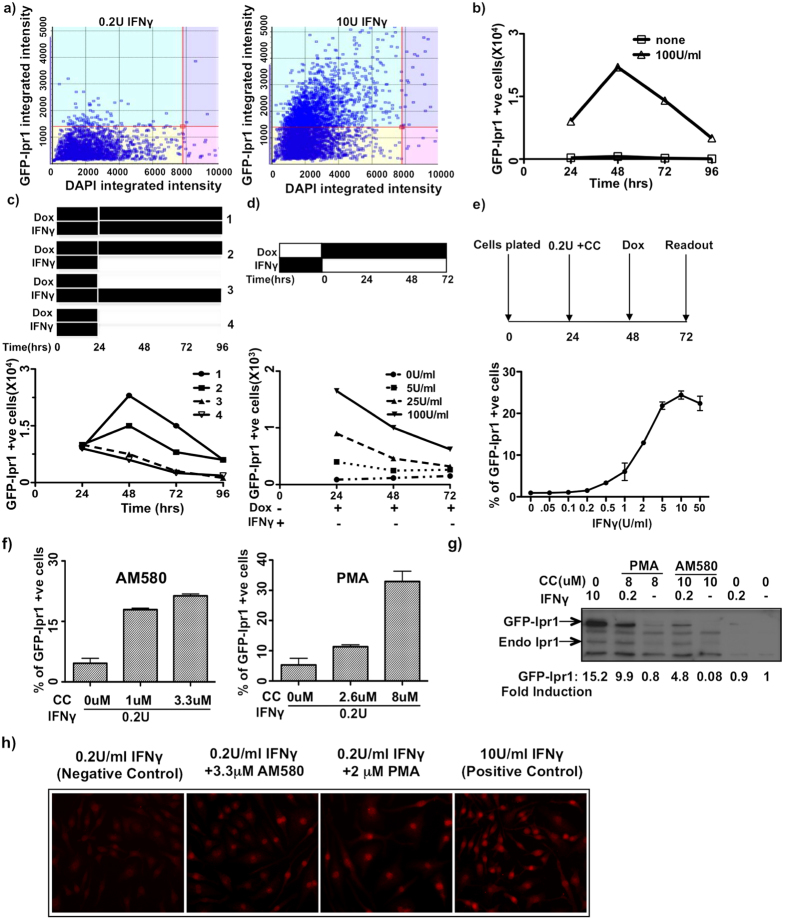
Figure 2. Development and validation of GFP-Ipr1 based screen for small molecules.
(a) J7-21 cells were treated with 0.2 U and 10 U/mL IFNγ in presence of 1 μg/mL dox for 24 hrs and GFP-Ipr1 expression measured. The gating strategy (mentioned in text) was used to quantify GFP-Ipr1 expression. (b) J7-21 cells were treated with 1 μg/mL dox alone (0 U/mL IFNγ) or in presence of 100 U/mL IFNγ for indicated times and fluorescence intensity of GFP-Ipr1 was measured. (c) J7-21 cells were primed with 1 μg/mL dox and 100 U/mL IFNγ for 24 hrs and then subjected to the following treatments for additional 72 hrs: 1.dox and IFNγ kept throughout, 2.dox kept and IFNγ removed, 3.dox removed and IFNγ kept, 4.dox and IFNγ removed. GFP-Ipr1 expression was measured using the celigo cytometer. (d) J7-21 cells were primed with 5, 25 and 100 U/mL IFNγ for 24 hrs and then removed. 1 μg/mL dox was added and expression of GFP-Ipr1 was measured after 24, 48 and 72 hrs. (e) J7-21 cells were treated with different doses of IFNγ for 24 hr. The next day dox(1 μg/mL) was added for 24 hrs and % of cells expressing GFP-Ipr1 was calculated. A schematic representation of the experiment for C, D and E are shown. (f) J7-21 cells were treated with different doses of AM580 and PMA in presence of IFNγ(0.2 U/mL) and 1 μg/mL dox and fluorescent intensity of GFP-Ipr1 expression was measured. Cells expressing GFP-Ipr1 was calculated as % expression with respect to 10 U/mL IFNγ. All graphs are representative of at least two independent experiments. (g) Immunoblot analysis of whole-cell extracts of J7-21 cells treated with 8 μM PMA and 10 μM AM580 in presence and absence of 0.2 U/mL IFNγ and 1 μg/mL dox for 24 hrs. Blots were probed with Ipr1 polyclonal antibodies. Blots are representative of two independent experiments. Fold induction of GFP-Ipr1 was calculated relative to expression in untreated cells (set as 1) by densitometric analysis after normalizing it to loading control β-actin. (h) Microscopy of BMDM from C57BL/6 mice cultured with 2 μM PMA and 3.3 μM AM580 in presence of 0.2 U/mL IFNγ for 24 hrs and stained with Ipr1 monoclonal antibody(red). Images represent data from two independent experiments performed in duplicates.

