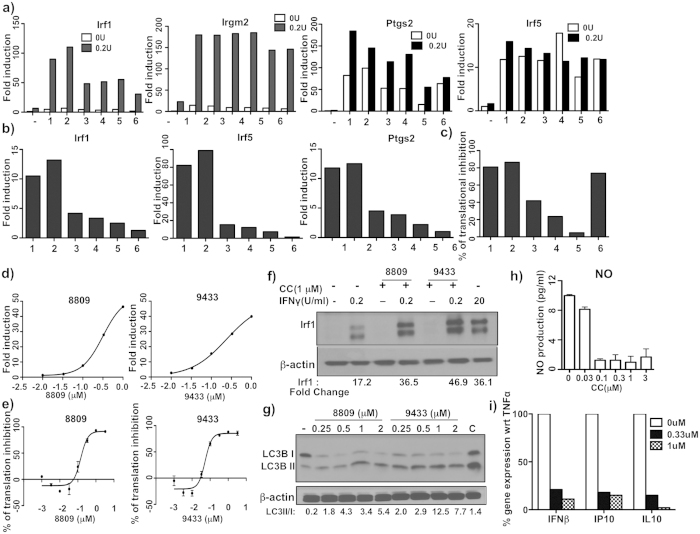
Figure 5. Comparative activity and characterization of new rocaglates.
(a) BMDM were treated with 1 μM compound (1-C9433, 2-C8809, 3-C10021, 4-C7564, 5-C7565, and 6-C10361) alone and in presence of 0.2 U/mL IFNγ for 24 hr. mRNA expression of Irf1, Irgm2, Irf5 and Ptgs2 was measured by qPCR. Data is presented relative to expression in untreated cells (set as 1). (b) BMDM were treated with 0.33 μM compounds (mentioned above) in presence and/or absence of 0.2 U/mL IFNγ for 24 hr. mRNA expression of Irf1, Irf5 and Ptgs2 was measured by qPCR. Data is presented relative to expression in 0.2U IFNγ treated cells for Irf1 and untreated for Irf5 and Ptgs2 (set as 1). (c) 293TR-FLuc cells were treated with 0.33 μM compounds (mentioned above) and luciferase activity was measured after 18 hrs. Data represents values from two independent experiments. (d) BMDM were treated with different doses of C9433 and C8809 in presence of 0.2 U/mL IFNγ for 24 hrs. mRNA expression of Irf1 was measured by qPCR. Data is presented relative to expression in 0.2U IFNγ treated cells (set as 1). (e) 293 T-FLuc cells were treated with different doses of C9433 and C8809 and the luciferase activity was measured after 18 hrs in triplicates. (f) BMDM were treated with C8809 and C9433 for 24 hrs in the presence and absence of 0.2 U/mL IFNγ and IRF1 induction was detected by immunoblotting. 20 U/mL IFNγ treated cells served as positive controls. (g) BMDM were treated with different doses of C8809 and C9433 for 6 hrs and probed with anti-LC3B mAb. A mix of chloroquine(10 μM) and rapamycin(500 nM) served as positive control (C). All immunoblots are representative of at least two independent experiments. (h) BMDM were treated with 15 ng/mL TNFα and 10 U/mL IFNγ for 24 hrs in the presence of different doses of C8809 and NO production was measured in triplicates. (i) BMDM were treated with 10 ng/ml TNFα in the presence of C8809 for 24 hrs. mRNA expression of IFNβ, IP10 and IL10 were measured by q-PCR. Data is calculated as % of gene expression relative to 10 ng/mL TNFα treated cells. All q-PCR results were normalized to expression of 18S and are representative of at least two independent experiments.

