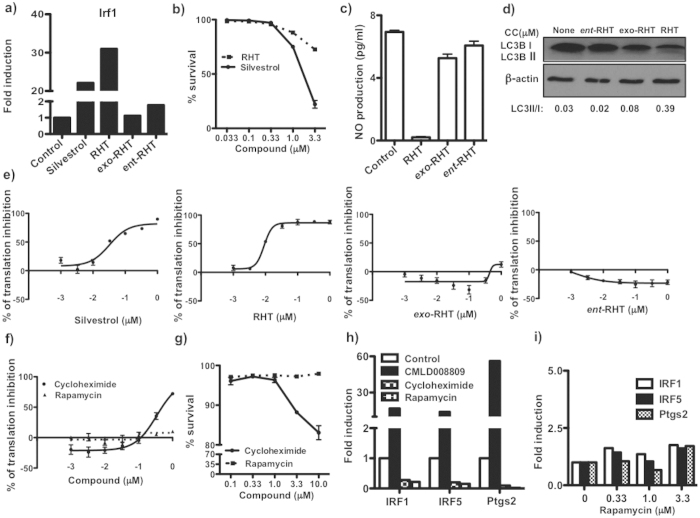
Figure 7. Comaparative activity of known rocaglates and translational inhibitors.
(a) BMDM were treated with 0.33 μM compounds in presence of 0.2 U/mL IFNγ for 24 hr. mRNA expression of Irf1 was measured by qPCR and normalized to expression of 18 S. Data is presented relative to expression in 0.2U IFNγ treated cells (set as 1) and represents results from two independent experiments. (b) BMDM were treated with silvestrol and RHT at concentrations shown for 24 hrs and % of PI positive cells were calculated. Data is represented as % of survival of two independent experiments performed in duplicates. (c) BMDM were treated with 15 ng/mL TNFα and 10 U/mL IFNγ for 24 hrs in the presence and absence of 1 μM compounds and production of NO (assayed as NO2−) was determined. All measurements for NO production were performed in triplicates. (d) BMDM were treated with 1 μM compounds for 6 hrs and autophagy was determined by increase of LC3B-II to LC3B-I ratio by immunoblotting. Blots represent data of two independent experiments. 293 T-FLuc cells were treated with different doses of (e) silvestrol, RHT, exo-RHT and ent-RHT and (f) cycloheximide and rapamycin. The luciferase activity was measured after 18 hrs. Data represents values from experiment performed in triplicates. (g) BMDM were treated with cycloheximide and rapamycin at concentrations shown for 24 hrs and % of PI positive cells were calculated. Data is represented as % of survival of two independent experiments performed in duplicates. (h) BMDM were treated with 0.33 μM compounds in presence of 0.2 U/mL IFNγ for 24 hr. mRNA expression of Irf1, Irf5 and Ptgs2 was measured by qPCR and normalized to expression of 18 S. Data is presented relative to expression in 0.2U IFNγ treated cells (set as 1) and represents results from two independent experiments. (i) BMDM were treated with 0.33, 1 and 3.3 μM rapamycin in presence of 0.2 U/mL IFNγ for 24 hr. mRNA expression of Irf1, Irf5 and Ptgs2 was measured by qPCR and normalized to expression of 18S. Data is presented relative to expression in 0.2U IFNγ treated cells (set as 1) and represents results from two independent experiments.

