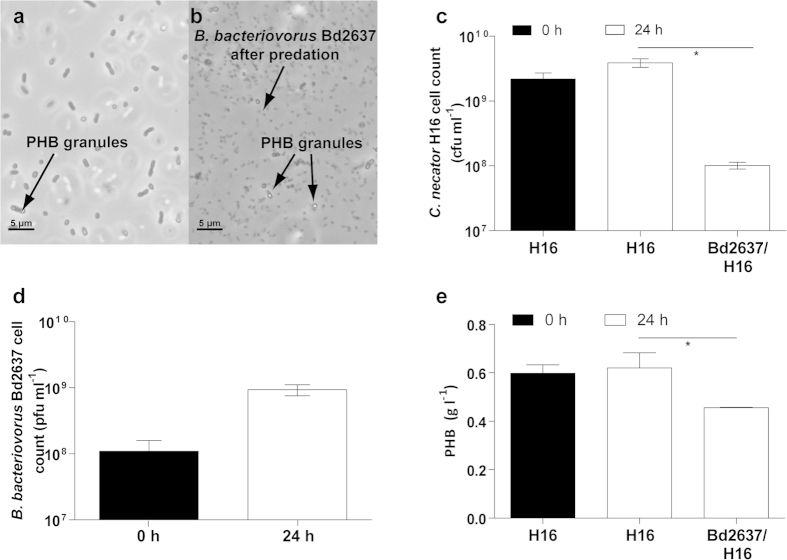
Figure 6. B. bacteriovorus Bd2637 preying on C. necator H16 accumulating PHB.
(a) Phase-contrast microscopy of the co-culture at the onset of predation (time zero) and (b) after 24 h of incubation with B. bacteriovorus. (c) Number of viable cells of C. necator H16 accumulating PHB at time zero and after 24 h of predation without and with B. bacteriovorus Bd2637. (d) Number of viable cells of B. bacteriovorus Bd2637 at time zero and after 24 h of predation upon C. necator H16 accumulating PHB. (e) Total PHB content in the co-cultures. In all graphs, error bars indicate the standard deviation of the mean (n = 3). Asterisk indicate significant differences (*P ≤ 0.05) between control prey culture (i.e., without the predator) and B. bacteriovorus Bd2637 co-cultures, as determined by ANOVA-test.

