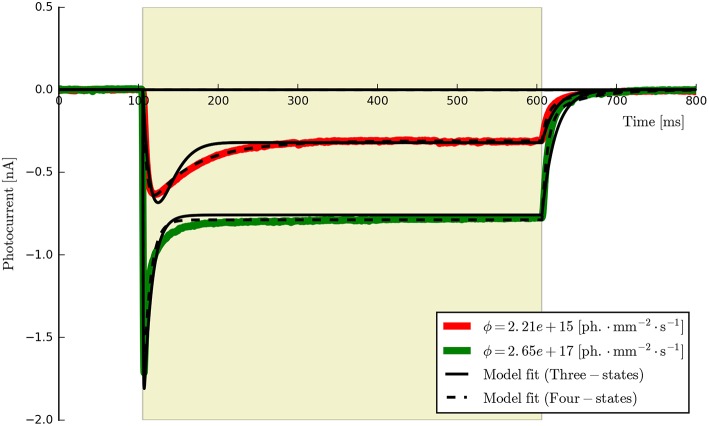
Figure 6.
The three- and four-state models fitted to the first two ChR2 photocurrents for comparison (the six-state fits are omitted since they are almost indistinguishable from the four-state fits at this time scale). While both models capture the major features of the data, the four-state (and six-state) models produce a higher quality of fit, particularly during the post-peak inactivation phase (where the three-state curves tend to over-shoot the data) and the deactivation (off) phases which are better described by a double rather than a single exponential decay process.

