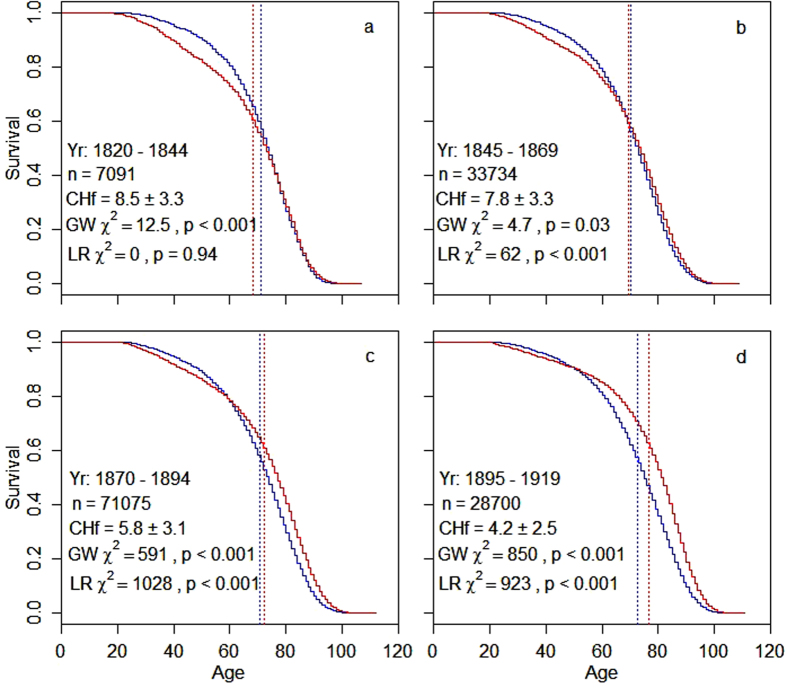
Figure 1. Age-specific survival after the onset of reproduction in four 25-year birth cohorts that cover the demographic transition in Utah.
Survival curves represent females (red) and males (blue) that reproduced and had full known reproductive history. Shown in each figure are the birth years contained in that cohort (Yr), the sample size (n), the average ± SD number of children born to females (CHf), the χ2 and p-values indicating differences in the survivor function between the two sexes from the Peto and Peto modification of the Gehan-Wilcoxon test (GW, this test weights differences in survivorship that occur early more heavily than differences at later survival times) and from a log-rank test (LR, this test weights differences at later survival times more heavily). Dotted vertical lines indicate the average lifespan of each sex in each cohort.

