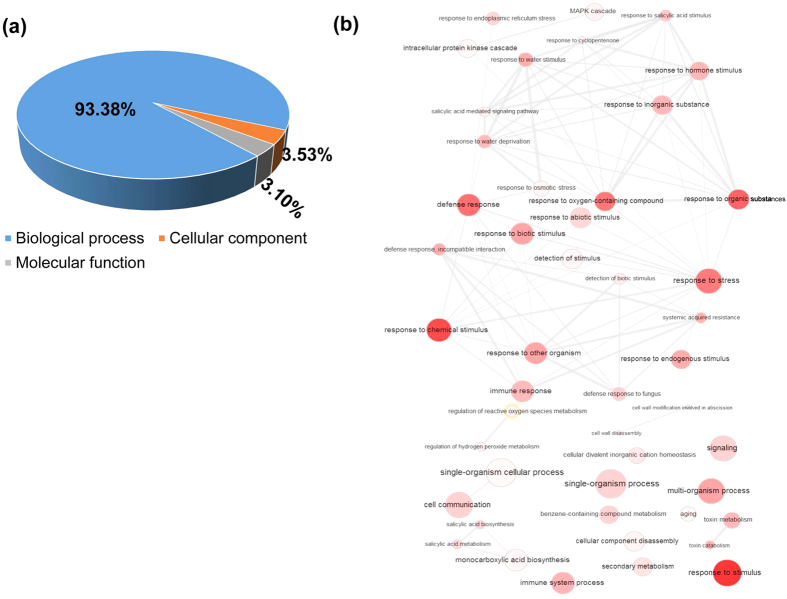
Figure 2. Gene ontology (GO) enrichment analysis of DEGs which were significantly affected (up- and down- regulated >15 FC) by TCV infection.
(a) Fraction distribution of DEGs related GO terms based on molecular function, biological process, and cellular component. (b) Interactive graph of biological process of 238 DEGs which are involved in the TCV infection. The size and red colour density of the circles are proportional to the number of genes associated with the specific term. The interactive network were summarized and plotted following published REVIGO protocol (http://revigo.irb.hr).

