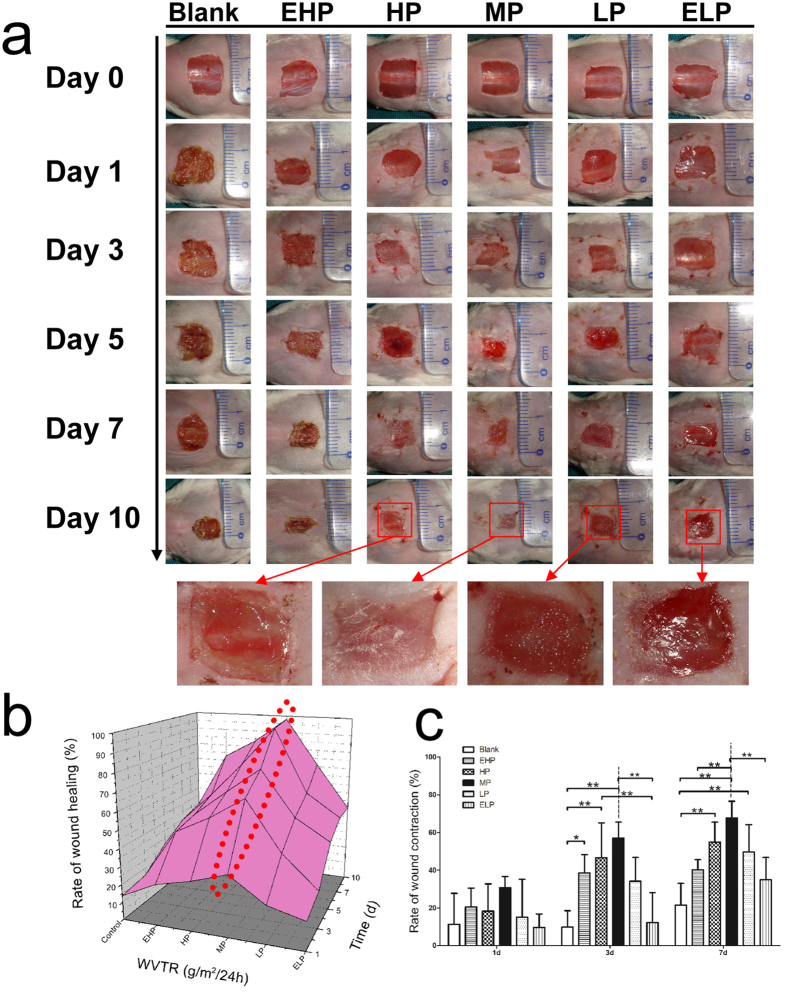
Figure 4. Wound healing experiment.
(a) The macroscopic appearance of the wounds postsurgery in the six groups at different time-points. (b) A three-dimensional diagram of wound healing. (c) The rates of wound contraction at different times. The values were calculated as the mean ± SD (n = 5), **p < 0.01, *p < 0.05. Wound healing was observed to accelerate when the MP-PU was applied.

