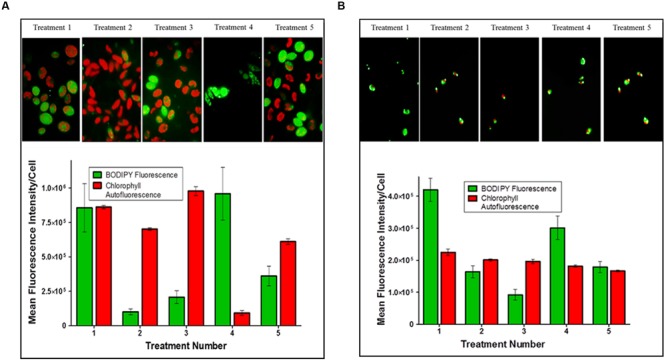
FIGURE 2.

triacylglycerides (TAG) induction in microalgal cultures. The arithmetic mean and standard deviation (n = 6) in fluorescence intensity per cell for (A) Scenedesmus sp. (strain 18B) and (B) Chlorella sp. (strain 15) treatment populations analyzed by multi-parameter flow cytometry. Cells were stained with BODIPY® 505/515 for TAG accumulation and auto-fluorescence was measured for chlorophyll content.
