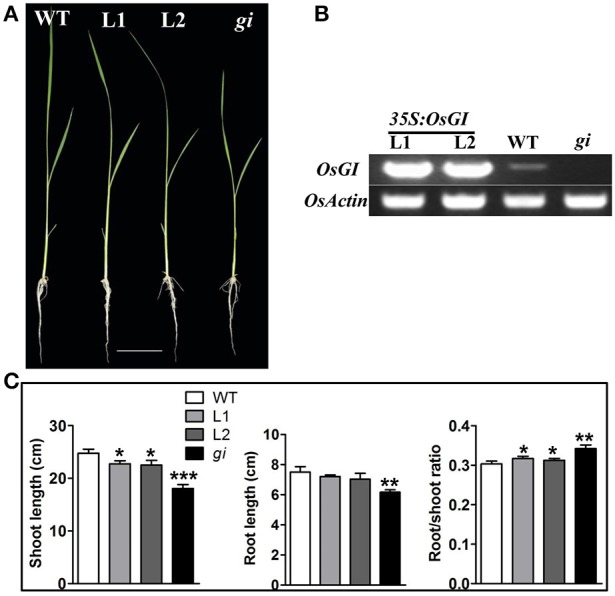
Figure 2.

Characterization of the growth phenotype in osgi-complemented plants. (A) WT, osgi mutant (gi) and two OsGI-complemented osgi mutant lines (L1 and L2) grown hydroponically under normal conditions for 14 days. (B) OsGI expression in WT, osgi, L1 or L2 plants 4 h after lights-on measured by RT-PCR. Plants were grown under normal conditions for 14 days. (C) Comparison of shoot length, root length and root/shoot ratio of WT, L1, L2 and osgi plants. All data represent the mean of three biological replicates, with error bars indicating SD. Significant differences relative to the corresponding WT strain are indicated with asterisks (***P < 0.001; **P < 0.01; and *P < 0.05). Bars = 4 cm.
