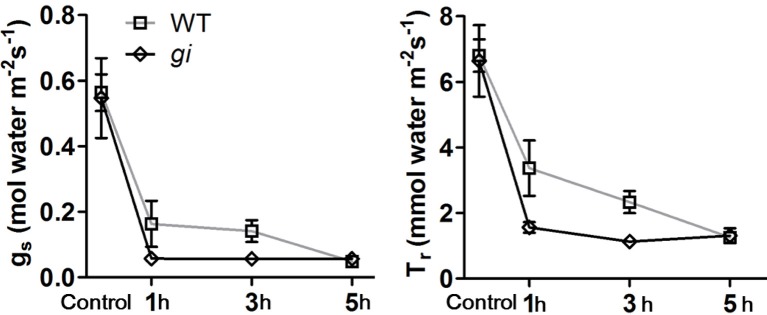
Figure 6.
Analysis of stomata conductance (gs) and transpiration rate (Tr) in WT and osgi plants. Stomata conductance (gs) and transpiration rate (Tr) in WT and osgi plants after PEG treatment for 1, 3, and 5 h. 35-day-old WT and osgi plants grown under normal conditions or treated with 18% PEG 8000 at 4, 6, and 8 h after lights-on, respectively, were used for the experiment. The gs and Tr were recorded in osgi and WT plants using an Li-6400 at 9 h after lights-on. All data represent the mean of three biological replicates, with error bars indicating SD.

