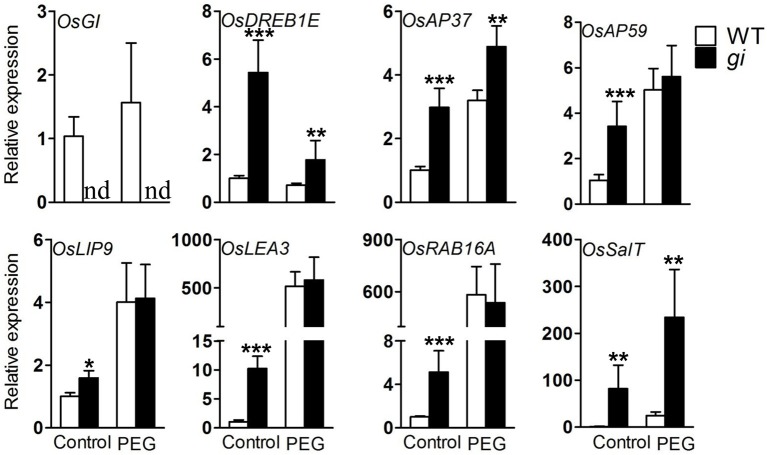
Figure 7.
Expression of water deficiency-related genes in WT and osgi leaves. WT and osgi plants were grown under normal conditions for 15 days and then cultured in 18% PEG 8000 or normal culture media for 2 days. Leaves were sampled 8 h after lights-on. Total RNA was extracted from the leaves and used for qRT-PCR. All data represent the mean of three biological replicates, with error bars indicating SD. Expression of OsACTIN was used as the internal control. Significant differences relative to the corresponding WT strain are indicated with asterisks (***P < 0.001; **P < 0.01; and *P < 0.05).

