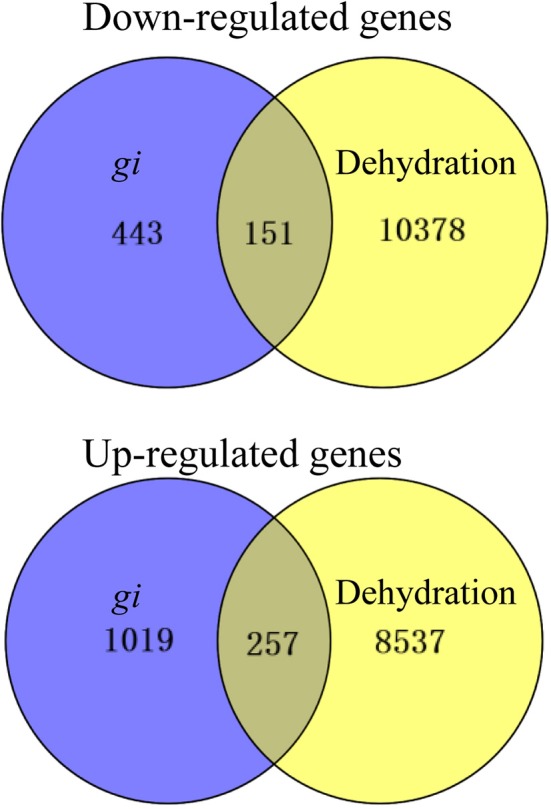
Figure 8.

Transcriptomic analyses of osgi and WT seedlings. Venn diagram representing the number of differentially expressed genes in osgi seedlings compared to WT seedlings grown under normal conditions (top; p < 0.05, PPDE > 0.95, 2-fold cut-off) or to WT seedlings exposed to dehydration conditions (bottom; Jain et al., 2007). For the microarray, rice seedlings were grown for 14 days under normal conditions before leaves were harvested.
